
Reports and Charts in Laravel: Two Useful Packages
 Povilas Korop
Founder of QuickAdminPanel
For bigger web-project with a lot of data we usually have to build a reporting system – with export to PDF/Excel, charts and graphs. There are many ways to do it, let’s look at the most popular ones.
Update: in February 2019 we released our own small Laravel package to generate simple charts.
JavaScript libraries
We won’t start with Laravel, first things first: generally, charts on the web are created with JavaScript. There are quite a few popular libraries for this:
And others. Most of them work in a way that there’s a <canvas> or <div> element which then gets filled with JavaScript “magic” – lines, colors, labels etc.
Here’s a simple example of Chart.js:
<canvas id="myChart" width="400" height="400"></canvas>
<script>
var ctx = document.getElementById("myChart").getContext('2d');
var myChart = new Chart(ctx, {
    type: 'bar',
    data: {
        labels: ["Red", "Blue", "Yellow", "Green", "Purple", "Orange"],
        datasets: [{
            label: '# of Votes',
            data: [12, 19, 3, 5, 2, 3],
            backgroundColor: [
                'rgba(255, 99, 132, 0.2)',
                'rgba(54, 162, 235, 0.2)',
                'rgba(255, 206, 86, 0.2)',
                'rgba(75, 192, 192, 0.2)',
                'rgba(153, 102, 255, 0.2)',
                'rgba(255, 159, 64, 0.2)'
            ],
            borderColor: [
                'rgba(255,99,132,1)',
                'rgba(54, 162, 235, 1)',
                'rgba(255, 206, 86, 1)',
                'rgba(75, 192, 192, 1)',
                'rgba(153, 102, 255, 1)',
                'rgba(255, 159, 64, 1)'
            ],
            borderWidth: 1
        }]
    },
    options: {
        scales: {
            yAxes: [{
                ticks: {
                    beginAtZero:true
                }
            }]
        }
    }
});
</script>
As you can see, it’s pretty simple, you just need to know the parameters – variables, labels, datasets, axes options etc. And every JavaScript library has some special sauce – different chart types, more/less parameters or better/worse documentation. So the choice is yours.
The main point – it is possible to draw charts just in JavaScript/jQuery, without Laravel packages, just getting data from database via Eloquent and passing it to Blade within JavaScript, like this:
  ...
  data: [{{ implode(',', $data }}],
  ...
But what if we want to do it more Laravel-way? We don’t want to mess with JavaScript and their parameters? There are two packages we can use.
ConsoleTVs/Charts
Creator of this package describes it: “Multi-library chart package to create interactive charts using Laravel”. And actually – the multi-library part is really important – this package can draw a chart using any of JavaScript libraries mentioned above, and even more.
Basically, it’s a wrapper for the front-end code, but you would write only back-end Laravel code and wouldn’t have to worry about JavaScript.
Here’s a sample Blade file from their documentation:
<!DOCTYPE html>
<html lang="en">
    <head>
        <meta charset="utf-8">
        <meta http-equiv="X-UA-Compatible" content="IE=edge">
        <meta name="viewport" content="width=device-width, initial-scale=1">

        <title>My Charts</title>

        {!! Charts::styles() !!}

    </head>
    <body>
        <!-- Main Application (Can be VueJS or other JS framework) -->
        <div class="app">
            <center>
                {!! $chart->html() !!}
            </center>
        </div>
        <!-- End Of Main Application -->
        {!! Charts::scripts() !!}
        {!! $chart->script() !!}
    </body>
</html>
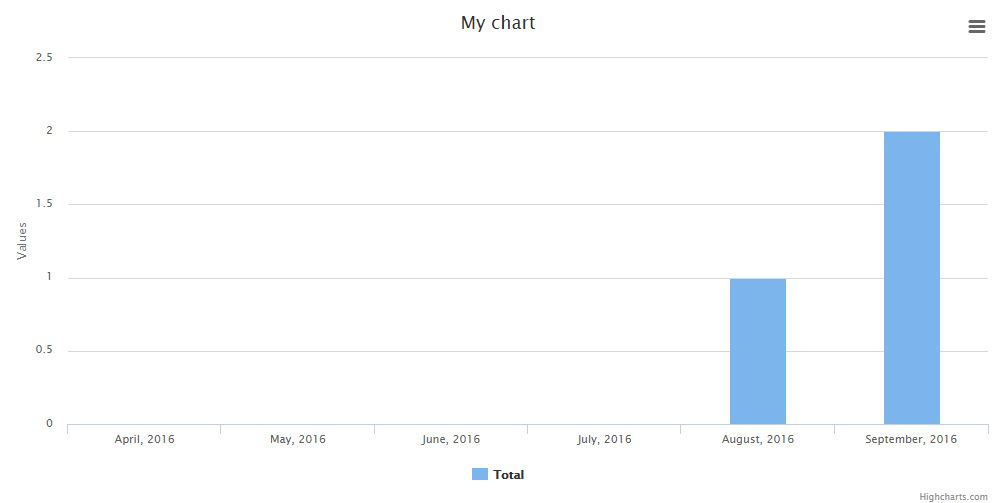
And then you’re passing the $chart variable from Controller, like this:
$chart = Charts::multi('bar', 'material')
    ->title("My Cool Chart")
    ->dimensions(0, 400) // Width x Height
    ->template("material")
    ->dataset('Element 1', [5,20,100])
    ->dataset('Element 2', [15,30,80])
    ->dataset('Element 3', [25,10,40])
    ->labels(['One', 'Two', 'Three']);

return view('test', ['chart' => $chart]);
Looks much more familiar in Laravel, right?
Also, you can define a lot of options in config/charts.php file, which is also a well-known structure.
So, I can recommend this package, URL again: https://github.com/ConsoleTVs/Charts
There are a few more Laravel packages related to charts, but in comparison, their functions are pretty limited – they are wrappers of one particular JS library, or similar.
Laravel Report Generator
From what I read online, terms “reports” and “charts” are sometimes used mixing those together. But in reality, chart is a visual representation of data, and report is more like a table or list of data.
So we have one strong package that will help you with your reports and forming PDF/Excel versions of them.
Meet https://github.com/Jimmy-JS/laravel-report-generator
It is a wrapper over Laravel-Dompdf and Laravel-Excel packages, utilizing them to form the reports like this:
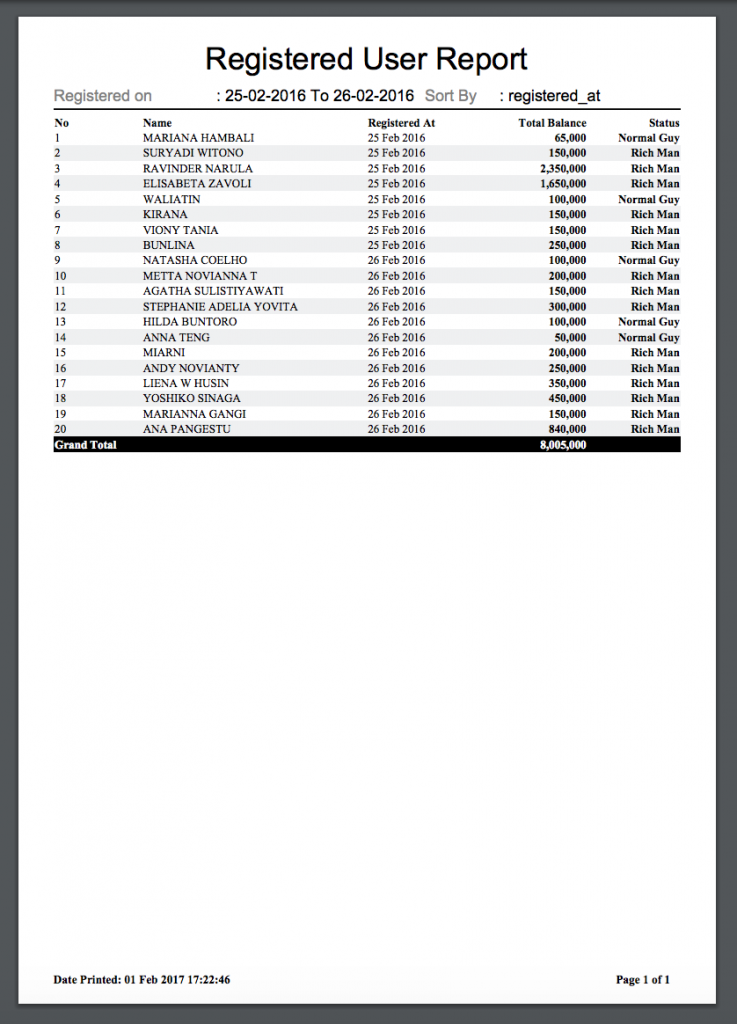
To be honest, there’s quite a lot of code to write, to get such (or similar) report:
use PdfReport;

public function displayReport(Request $request) {
    // Retrieve any filters
    $fromDate = $request->input('from_date');
    $toDate = $request->input('to_date');
    $sortBy = $request->input('sort_by');

    // Report title
    $title = 'Registered User Report';

    // For displaying filters description on header
    $meta = [
        'Registered on' => $fromDate . ' To ' . $toDate,
        'Sort By' => $sortBy
    ];

    // Do some querying..
    $queryBuilder = User::select(['name', 'balance', 'registered_at'])
                        ->whereBetween('registered_at', [$fromDate, $toDate])
                        ->orderBy($sortBy);

    // Set Column to be displayed
    $columns = [
        'Name' => 'name',
        'Registered At',
        'Total Balance' => 'balance',
        'Status' => function($result) {
            return ($result->balance > 100000) ? 'Rich Man' : 'Normal Guy';
        }
    ];

    return PdfReport::of($title, $meta, $queryBuilder, $columns)
                    ->editColumn('Registered At', [
                        'displayAs' => function($result) {
                            return $result->registered_at->format('d M Y');
                        }
                    ])
                    ->editColumn('Total Balance', [
                        'displayAs' => function($result) {
                            return thousandSeparator($result->balance);
                        }
                    ])
                    ->editColumns(['Total Balance', 'Status'], [
                        'class' => 'right bold'
                    ])
                    ->showTotal([
                        'Total Balance' => 'point' // if you want to show dollar sign ($) then use 'Total Balance' => '$'
                    ])
                    ->limit(20)
                    ->stream(); // or download('filename here..') to download pdf
}
Still, it’s much more convenient than building PDF one line after another, or from HTML code.
Link to the package again: https://github.com/Jimmy-JS/laravel-report-generator
So, these are two of my favorites. Anything to add?
Final note: in our QuickAdminPanel module called Reports generator, we use simple Chart.js library, here’s a short video about how it works.