Demo: Transactions Datatables with Date Range Filter and Chart on Top
 Povilas Korop
Founder of QuickAdminPanel
One of our customers asked how to add a date from-to filter on top of a default datatable. So we created a demo-project and here I will explain how it works.
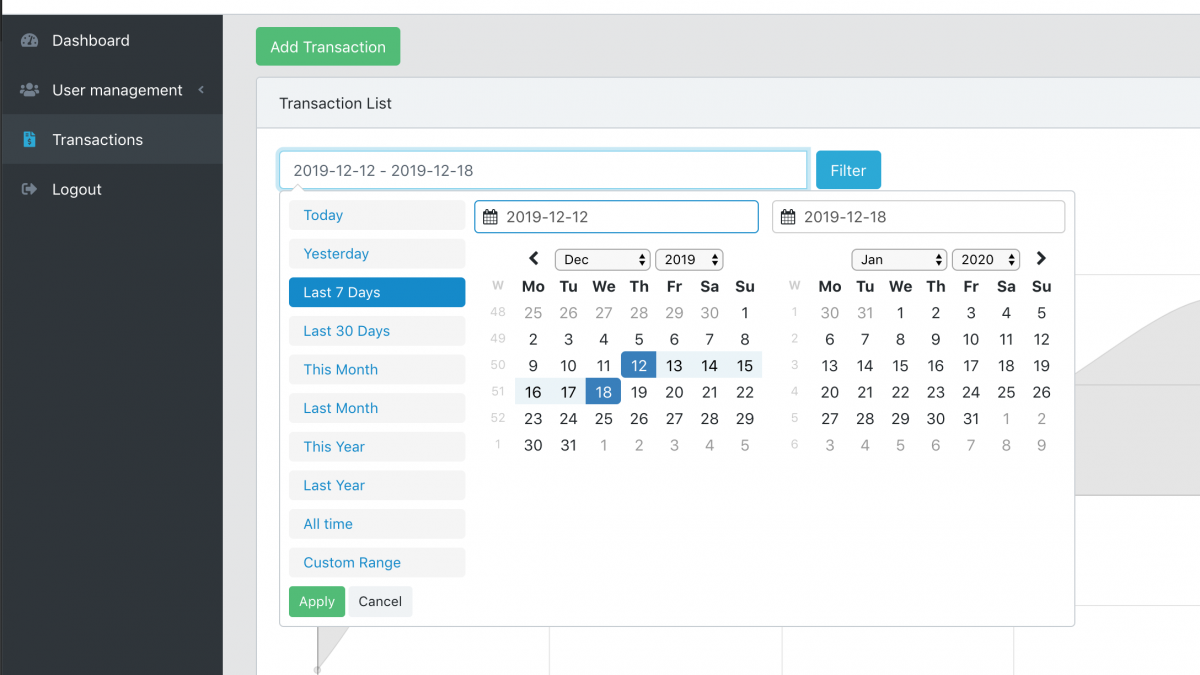
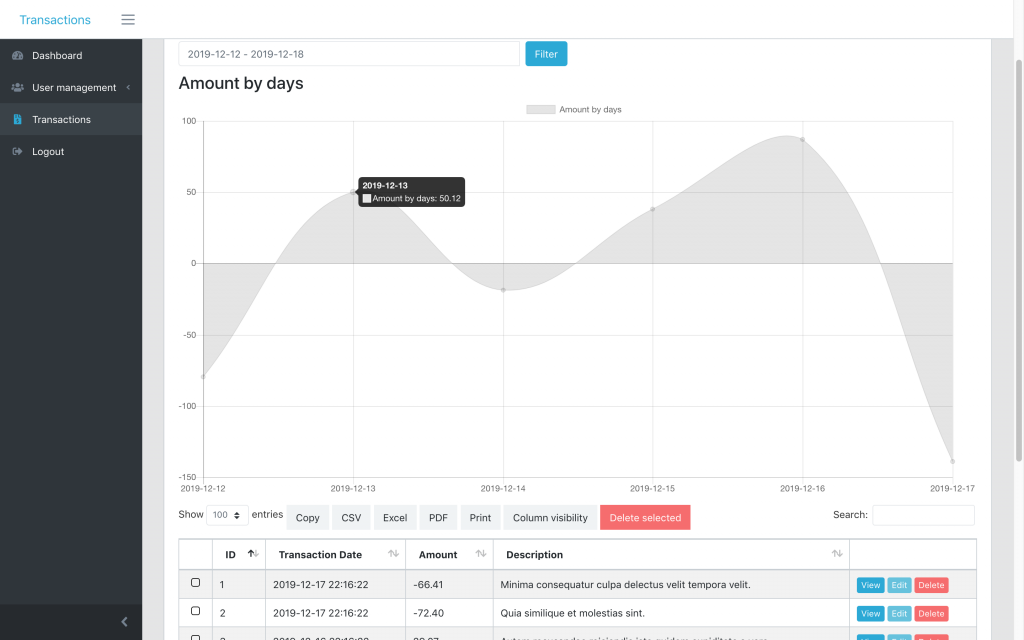
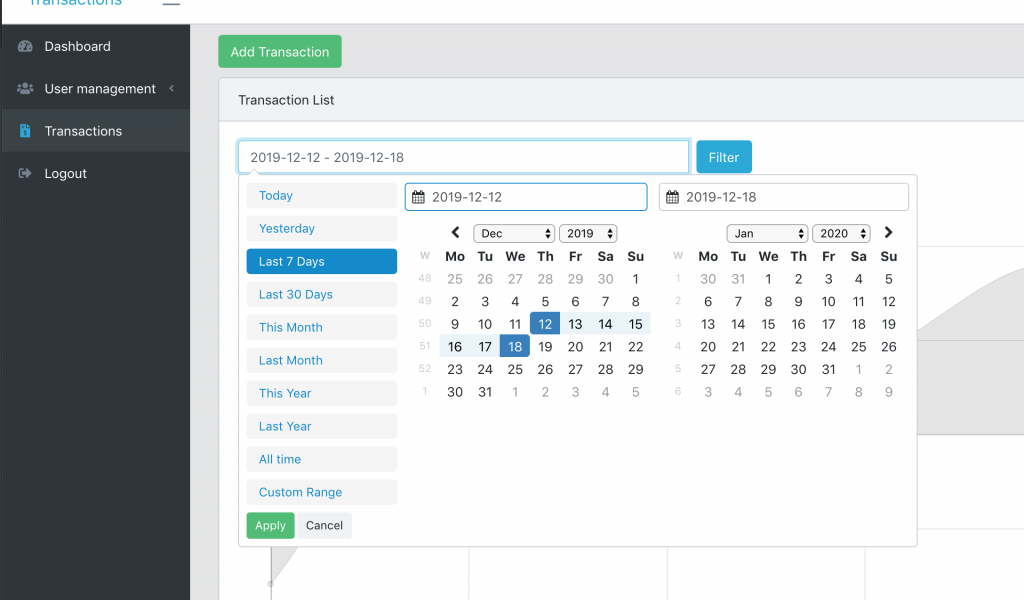
First, how it looks – just the list of transaction, filtered by date from-to, and with chart of sum amounts per day:
Second, link to the repository: Laravel Datatables Dates Chart
Now, to the code. How did we add a date range filter and chart to the top of the table?
Blade file components: DateRangePicker
First, in the file resources/views/admin/transactions/index.blade.php we add this HTML before the code of a typical datatable:
<div class="row">
    <div class="col-md-6">
    <form action="" id="filtersForm">
        <div class="input-group">
        <input type="text" name="from-to" class="form-control mr-2" id="date_filter">
        <span class="input-group-btn">
            <input type="submit" class="btn btn-primary" value="Filter">
        </span>
        </div>
    </form>
    </div>
</div>
<div class="row my-2" id="chart">
    <div class="{{ $chart->options['column_class'] }}">
        <h3>{!! $chart->options['chart_title'] !!}</h3>
        {!! $chart->renderHtml() !!}
    </div>
</div>
<table class=" table table-bordered table-striped table-hover ajaxTable datatable datatable-Transaction">
The last line is the beginning of the table itself. Now, that table should be filtered by date range, right?
So here’s the JavaScript which should be somewhere in the same Blade file below:
  let searchParams = new URLSearchParams(window.location.search)
  let dateInterval = searchParams.get('from-to');
  let start = moment().subtract(29, 'days');
  let end = moment();

  if (dateInterval) {
      dateInterval = dateInterval.split(' - ');
      start = dateInterval[0];
      end = dateInterval[1];
  }

  $('#date_filter').daterangepicker({
      "showDropdowns": true,
      "showWeekNumbers": true,
      "alwaysShowCalendars": true,
      startDate: start,
      endDate: end,
      locale: {
          format: 'YYYY-MM-DD',
          firstDay: 1,
      },
      ranges: {
          'Today': [moment(), moment()],
          'Yesterday': [moment().subtract(1, 'days'), moment().subtract(1, 'days')],
          'Last 7 Days': [moment().subtract(6, 'days'), moment()],
          'Last 30 Days': [moment().subtract(29, 'days'), moment()],
          'This Month': [moment().startOf('month'), moment().endOf('month')],
          'Last Month': [moment().subtract(1, 'month').startOf('month'), moment().subtract(1, 'month').endOf('month')],
          'This Year': [moment().startOf('year'), moment().endOf('year')],
          'Last Year': [moment().subtract(1, 'year').startOf('year'), moment().subtract(1, 'year').endOf('year')],
          'All time': [moment().subtract(30, 'year').startOf('month'), moment().endOf('month')],
      }
  });
Final thing with the dates – we need to actually filter the data for the table by those dates.
So we go to app/Http/Controllers/Admin/TransactionsController.php and method index().
To get the data, we use Laravel Datatables package, which forms Eloquent query and then passes it to Datatables.
We will add Eloquent Query Scope to it.
Before:
$query = Transaction::query()
    ->select(sprintf('%s.*', (new Transaction)->table));
$table = Datatables::of($query);
After:
$query = Transaction::query()
    ->filterDates()
    ->select(sprintf('%s.*', (new Transaction)->table));
$table = Datatables::of($query);
See filterDates()? It will be a filter scope inside of app/Transaction.php model:
public function scopeFilterDates($query)
{
    $date = explode(" - ", request()->input('from-to', ""));

    if(count($date) != 2)
    {
        $date = [now()->subDays(29)->format("Y-m-d"), now()->format("Y-m-d")];
    }

    return $query->whereBetween('transaction_date', $date);
}
And that’s it, we will have the filter active on the table.
Drawing Chart with Laravel Charts Package
Second part of this tutorial is the chart. I will repeat the Blade code for them, from above:
<div class="row my-2" id="chart">
    <div class="{{ $chart->options['column_class'] }}">
        <h3>{!! $chart->options['chart_title'] !!}</h3>
        {!! $chart->renderHtml() !!}
    </div>
</div>
Looks pretty weird, right? What is a $chart and methods like renderHtml()? They come from our own package Laravel Charts, to draw simple charts like this one.
We use that package inside of QuickAdminPanel for Dashboard and Reports module, and in this case to build a chart – this is the code we need to add in app/Http/Controllers/Admin/TransactionsController.php – index() method:
use LaravelDaily\LaravelCharts\Classes\LaravelChart;

// ...

$date = explode(" - ", request()->input('from-to', ""));

if(count($date) != 2)
{
    $date = [now()->subDays(29)->format("Y-m-d"), now()->format("Y-m-d")];
}

$settings = [
    'chart_title'           => 'Amount by days',
    'chart_type'            => 'line',
    'report_type'           => 'group_by_date',
    'model'                 => 'App\\Transaction',
    'group_by_field'        => 'transaction_date',
    'group_by_period'       => 'day',
    'aggregate_function'    => 'sum',
    'aggregate_field'       => 'amount',
    'filter_field'          => 'transaction_date',
    'range_date_start'      => $date[0],
    'range_date_end'        => $date[1],
    'group_by_field_format' => 'Y-m-d H:i:s',
    'column_class'          => 'col-md-12',
    'entries_number'        => '5',
    'continuous_time'       => true,
];

$chart = new LaravelChart($settings);

return view('admin.transactions.index', compact('chart'));
And that’s it, chart is also done. Hope that helps!
Link to the core repository again: LaravelDaily/Laravel-Datatables-Dates-Chart